Many experienced SPFx developers know you don’t have to debug your web part in the workbench in SharePoint Online. While the workbench is great, there are certain things that you just can’t test there such as application customizers and full-width web part zones. In the past six months or so, I’ve mentored a number of new SPFx developers and this gets them hung up every time.
To debug your web part on an existing SharePoint page, start by running gulp serve just like your normally would. Now, navigate to that page and then append the following to the query string:
?loadSPFX=true&debugManifestsFile=https://localhost:4321/temp/manifests.jsWhen the page loads, you will be prompted to allow debug scripts. Click the Load debug scripts and your web part will be loaded just like it would in the workbench.

If you haven’t added this web part to the page before, you can now add it.

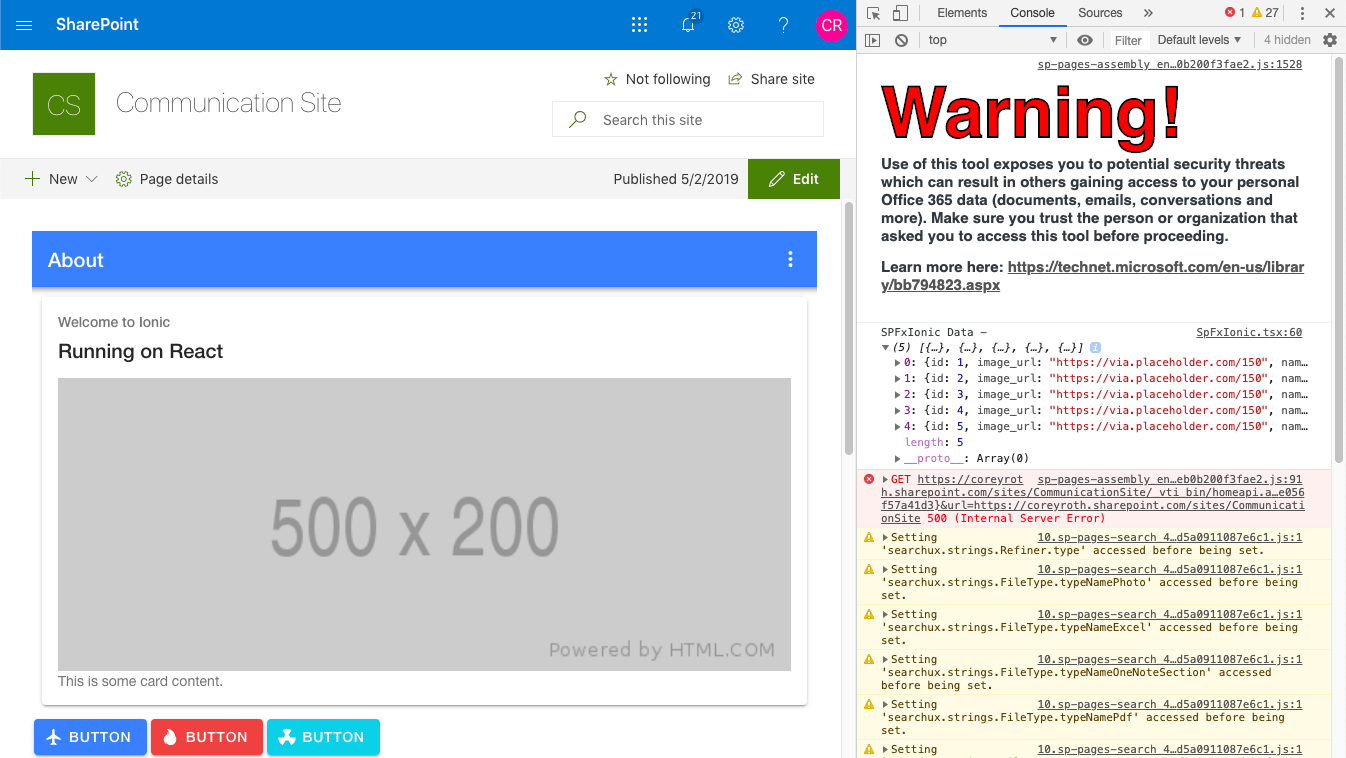
Then when you view the developer console, you can see that the files are being served locally. You can set breakpoints from the source tab (or in VS Code if you have it set up) just like you could with the workbench.

You can set breakpoints from the source tab (or in VS Code if you have it set up) just like you could with the workbench.

The only real difference here is that you have to refresh the page manually after your code builds.
Again, I know a lot of SPFx developers already know about this but I keep finding that new developers don’t realize this so I wanted to put something quick together on it.
